StockPulse
Inventory intelligence for a distributor that only has stock reports
Turns a retailer's periodic stock exports into movement, velocity and reorder signals by diffing consecutive snapshots. No sales history needed.
- Client
- Electronics distributor
- Role
- Sole engineer
- Year
- 2026
- Stack
- FastAPI, pandas, openpyxl, xlrd
01The numbers
02The problem
The client's billing software exports stock levels, not sales. Without sales history there's no velocity, no reorder point and no view of dead stock, just two spreadsheets from two different days. One of them is a 119k-row legacy .xls.
03What I built
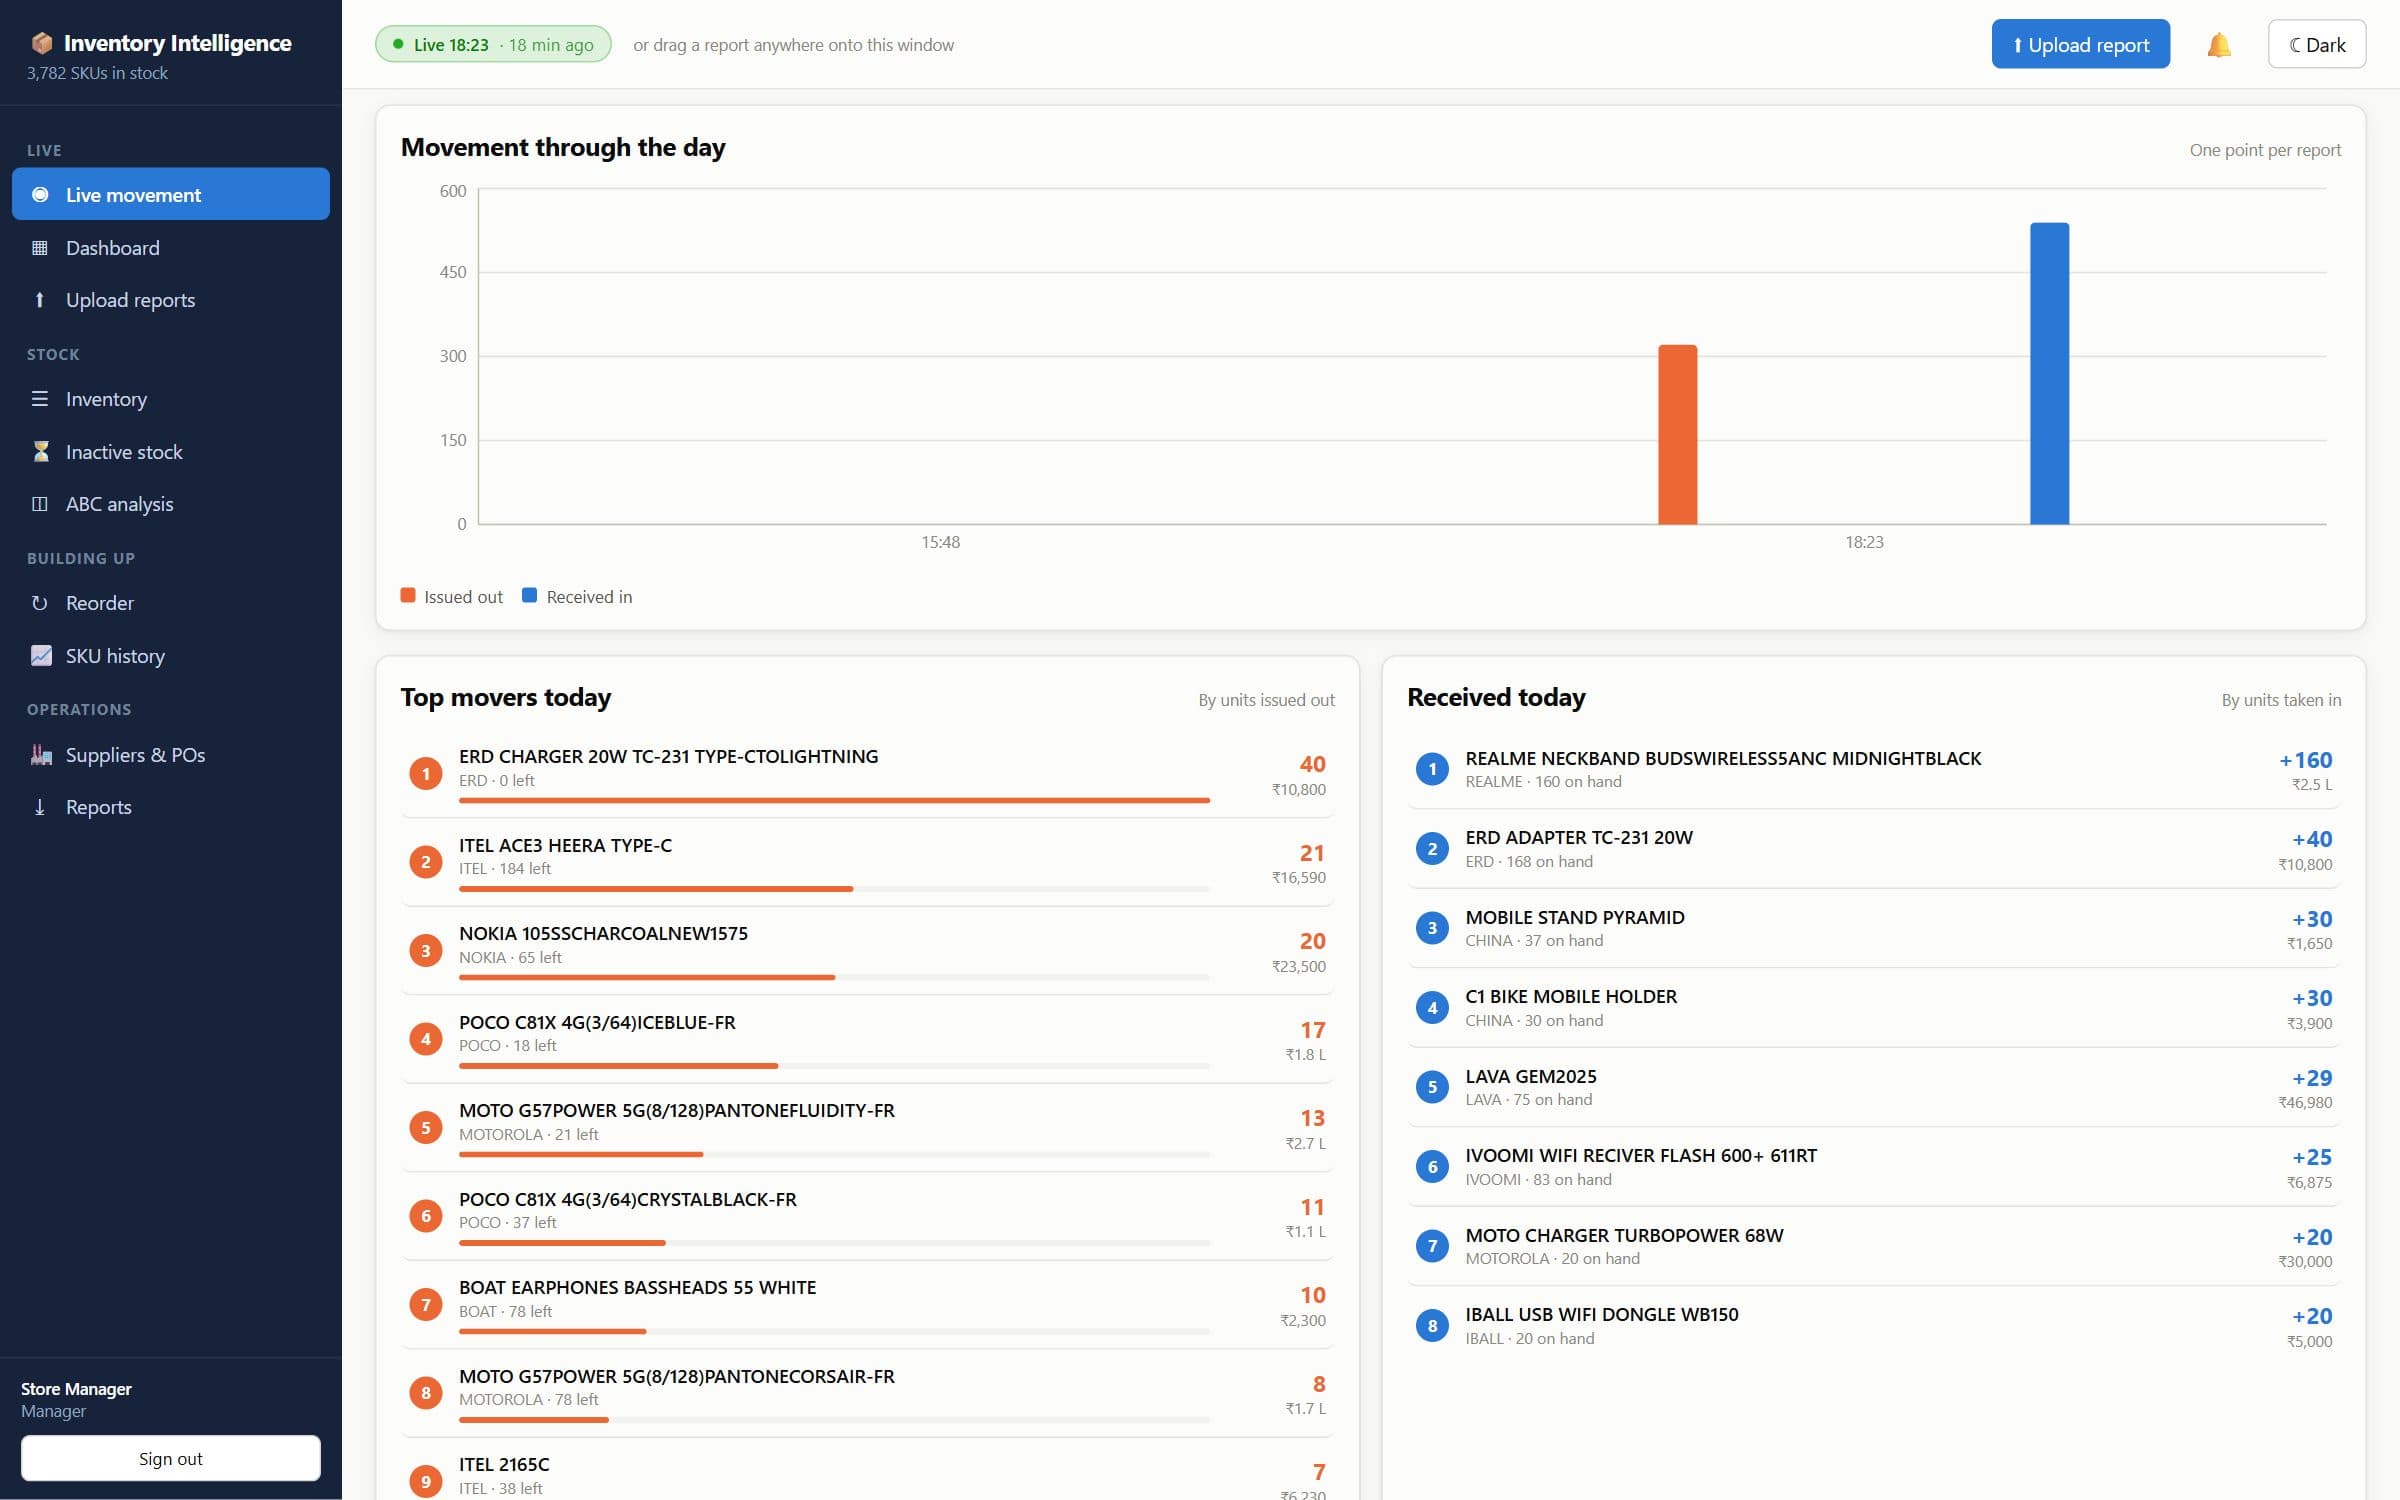
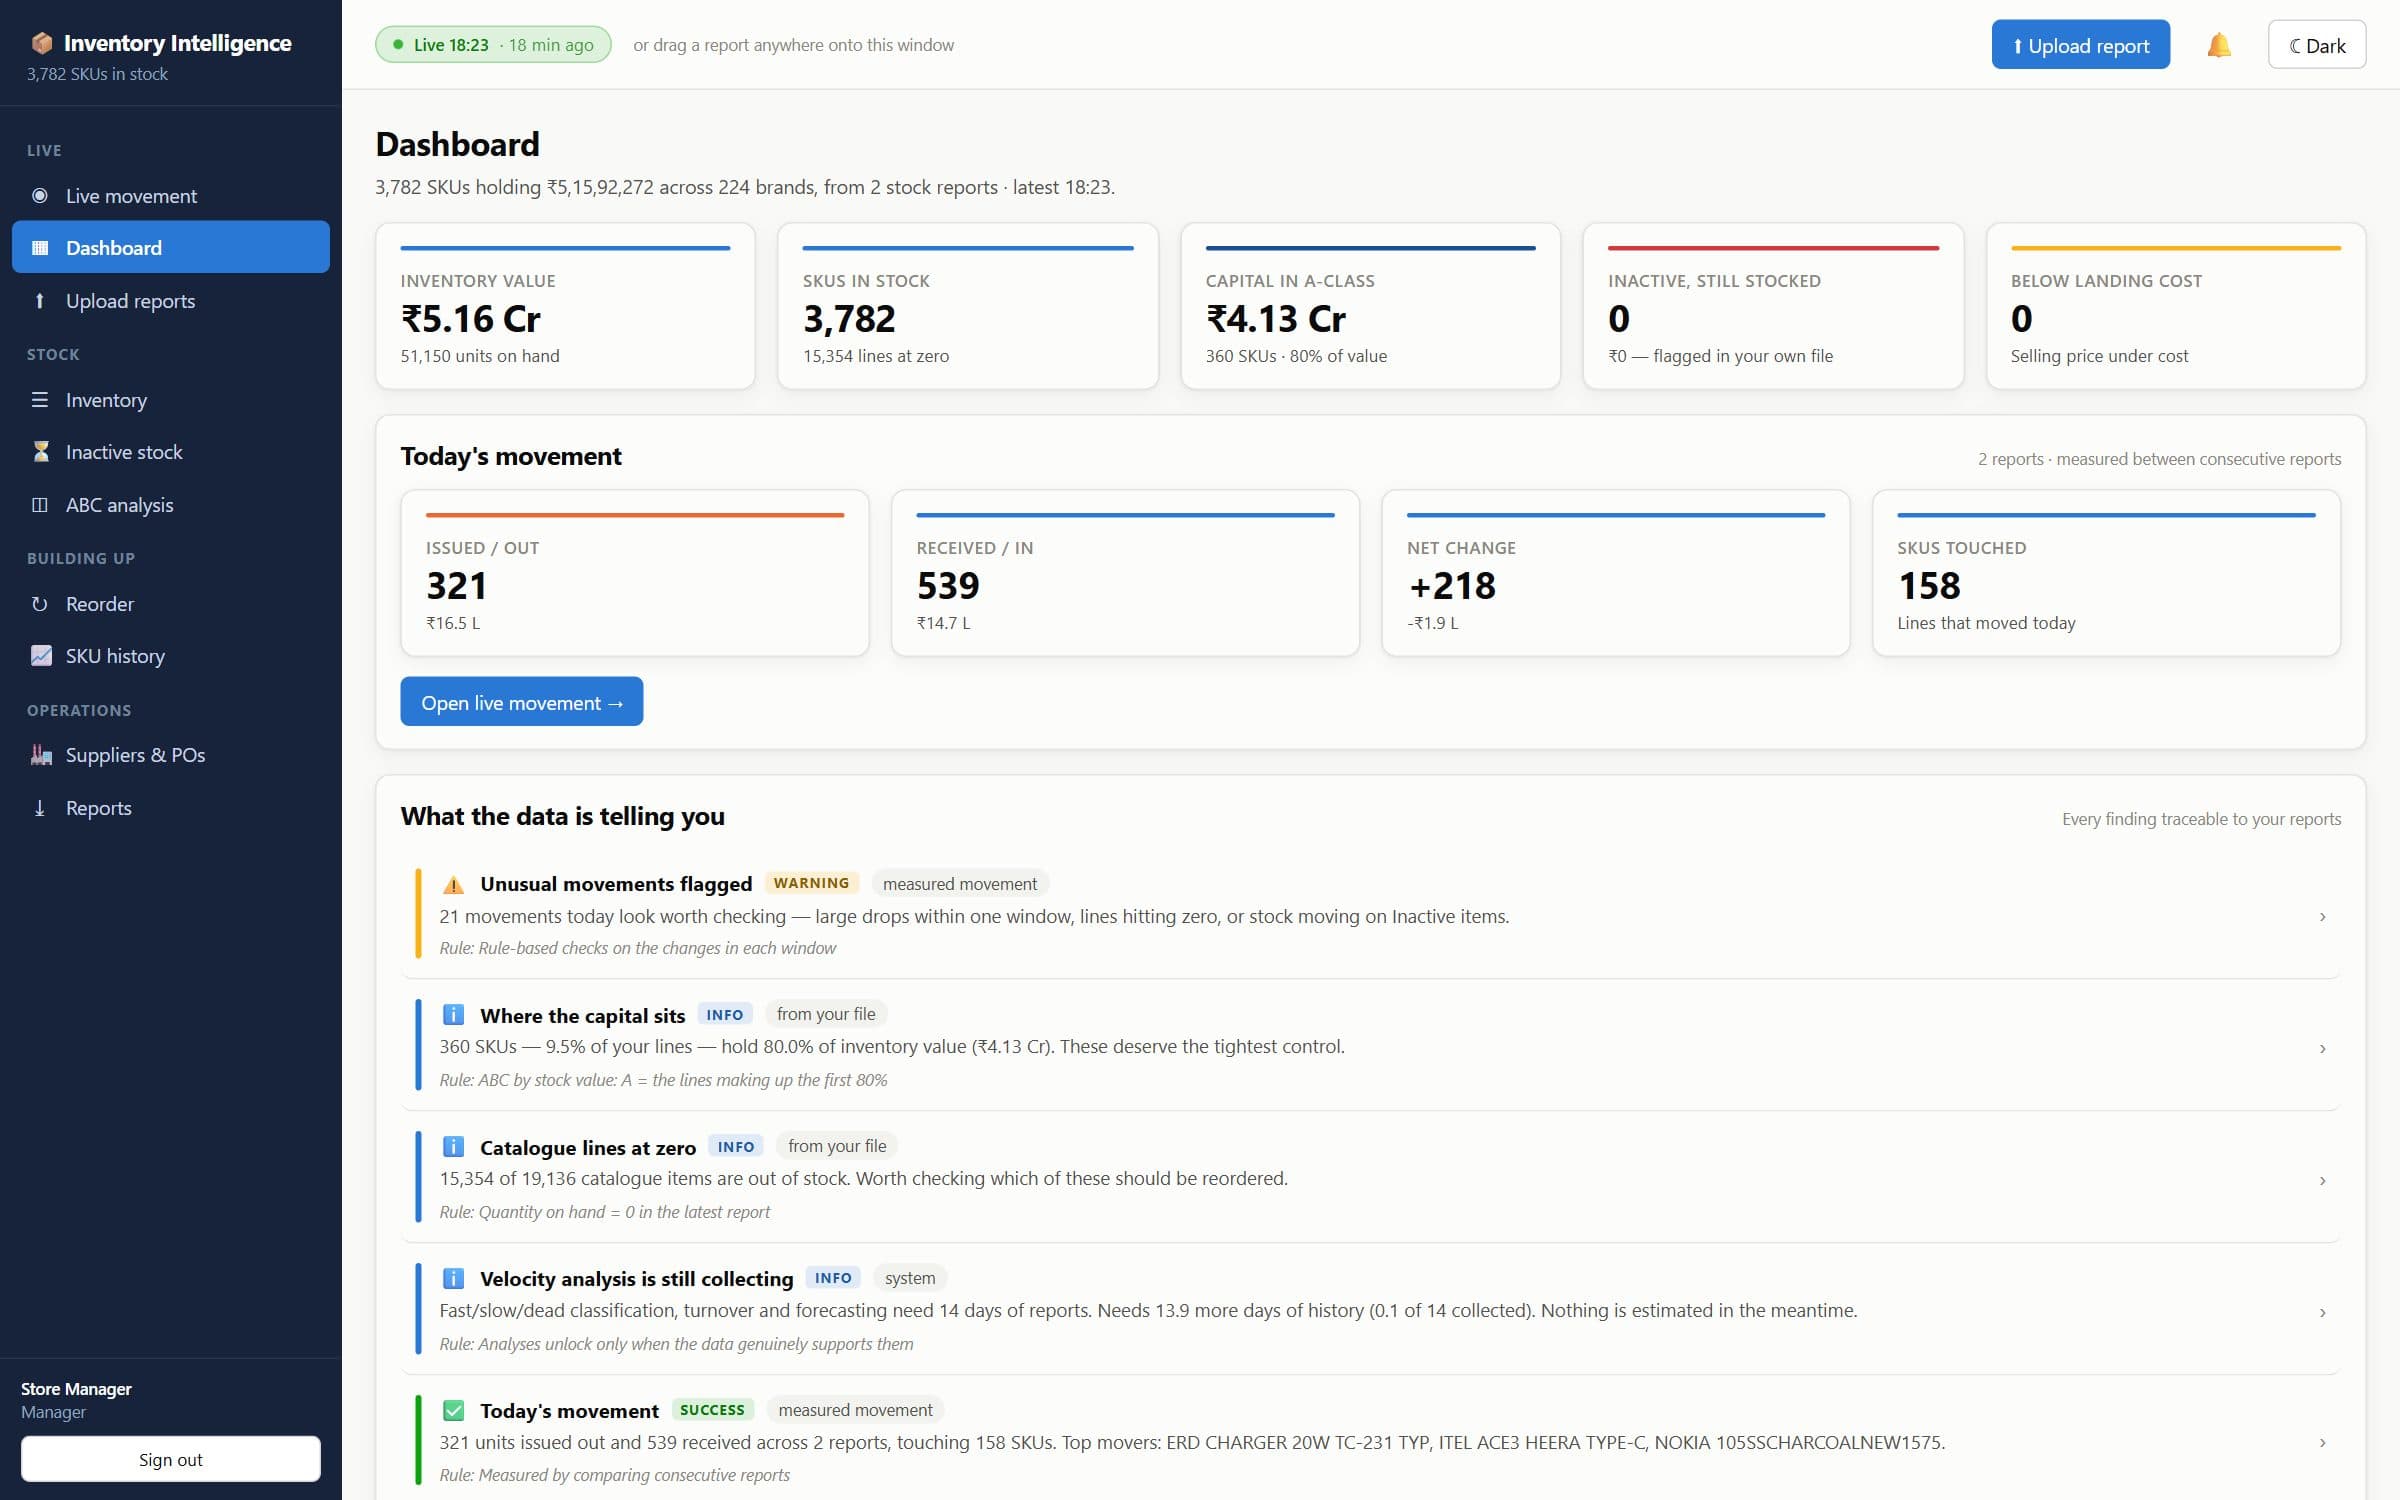
Each upload becomes a timestamped snapshot, and the difference between consecutive snapshots is the movement: what went out and what came in. The importer detects both export formats and finds the header row by itself.
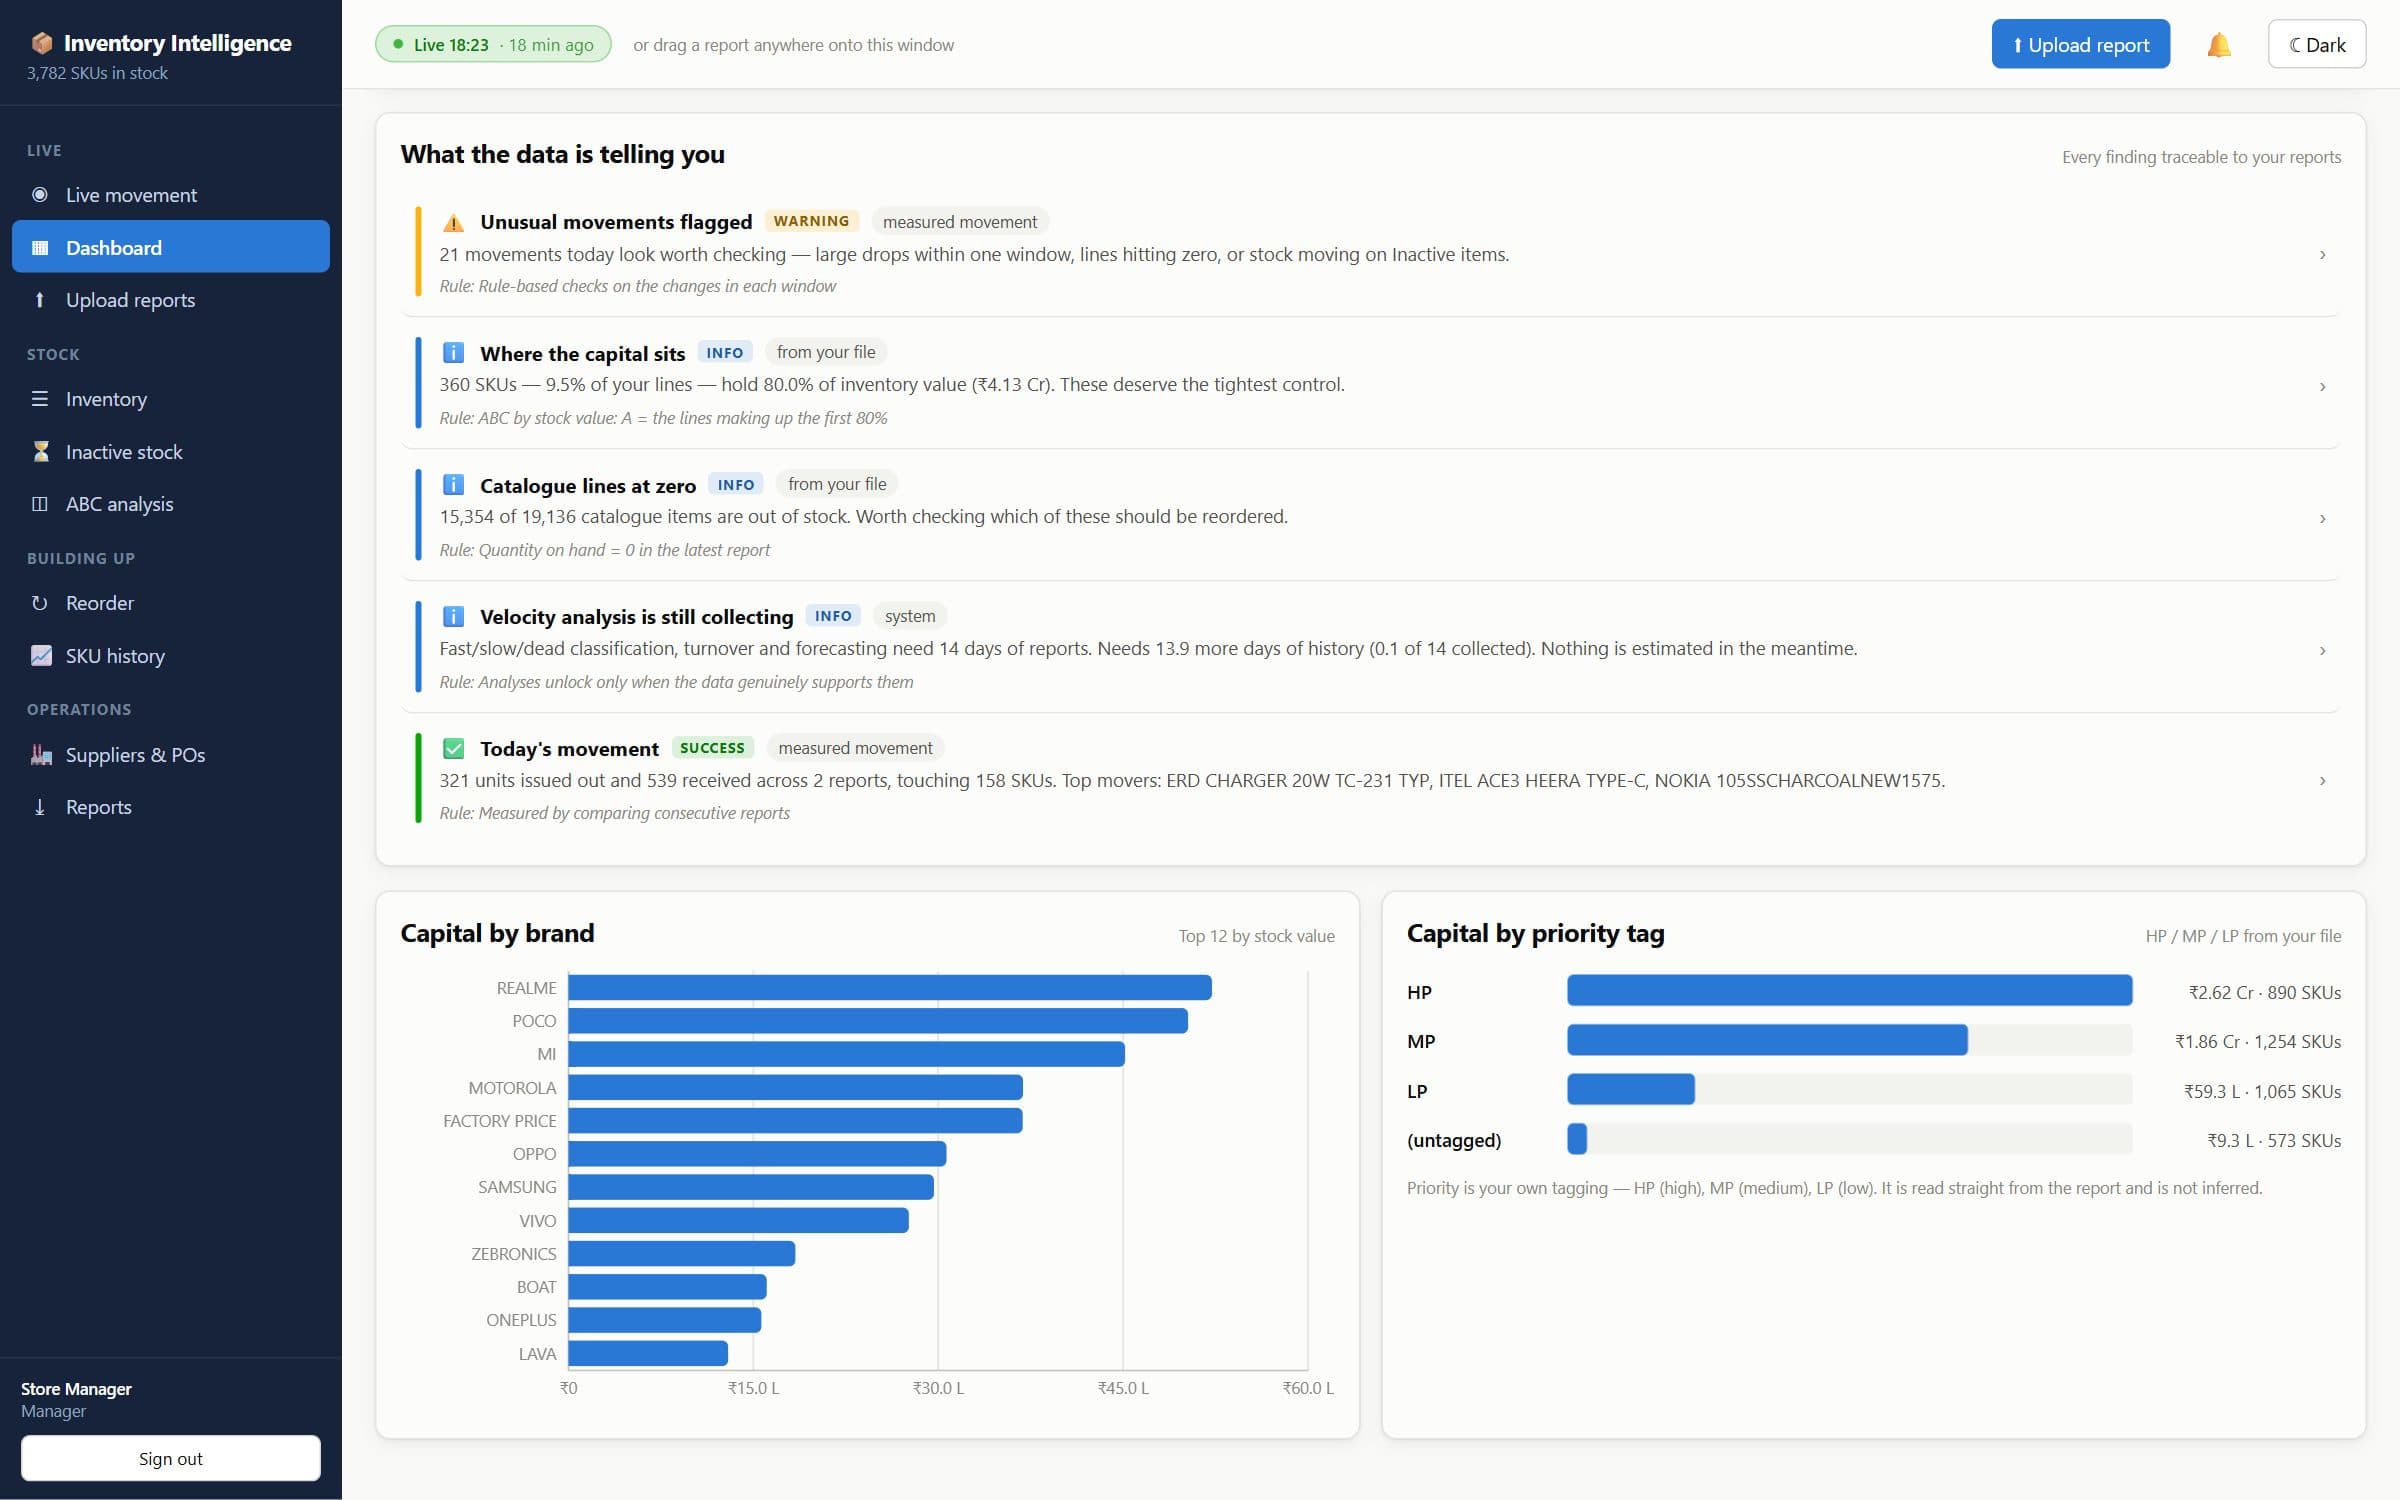
Analytics unlock as data builds up. One report gives valuation and ABC classes. Two give live movers and anomalies. A week gives trends, and two weeks give velocity, reorder points, XYZ classes and a forecast. The system learns how often the client reports and flags a report as overdue once it's twice as late as usual.
Before trusting any chart I proved what the columns mean. ‘FINAL TOTAL’, for example, is value, not quantity: 1,633 of 3,086 SKUs match exactly.
04Architecture
05Engineering notes
- No simulated data anywhere. Every screen runs on the client's own exports.
- Undo for the latest snapshot, and Excel and PDF exports for the owners.
- Every chart uses a colour-blind-safe palette.
- About 34 endpoints over 7 routers, with arithmetic, cadence and dual-format self-tests.
06Stack